People Matter Survey and Workforce Data Digitisation
From data to dialogue. Transforming Victorian public sector workforce data into engaging digital insights for meaningful change.
Design challenge
Workforce data has the power to drive better decisions and create meaningful change — but only if people can actually use it.
Previously, the Victorian Public Sector Commission (VPSC) published results from the People Matter Survey and workforce data collection in a printed book.
This was not only expensive and inefficient to produce, but it was hard for users to find answers, compare results, or explore trends across years and demographics.
Users faced major barriers:
Insights were buried in hundreds of pages of static tables.
Users couldn’t filter, compare or explore data on their own terms.
Printing and distribution costs were high and environmentally unsustainable.
Organisations struggled to turn broad, static data into targeted improvements for employees.
The public had limited visibility of how the sector was performing.
The design challenge: replace the expensive annual printed report with a dynamic, user-friendly, digital experience that improves transparency, usability and impact across the entire Victorian Government.
Transforming an expensive annual print publication into an interactive, digital product for Victoria’s public sector.
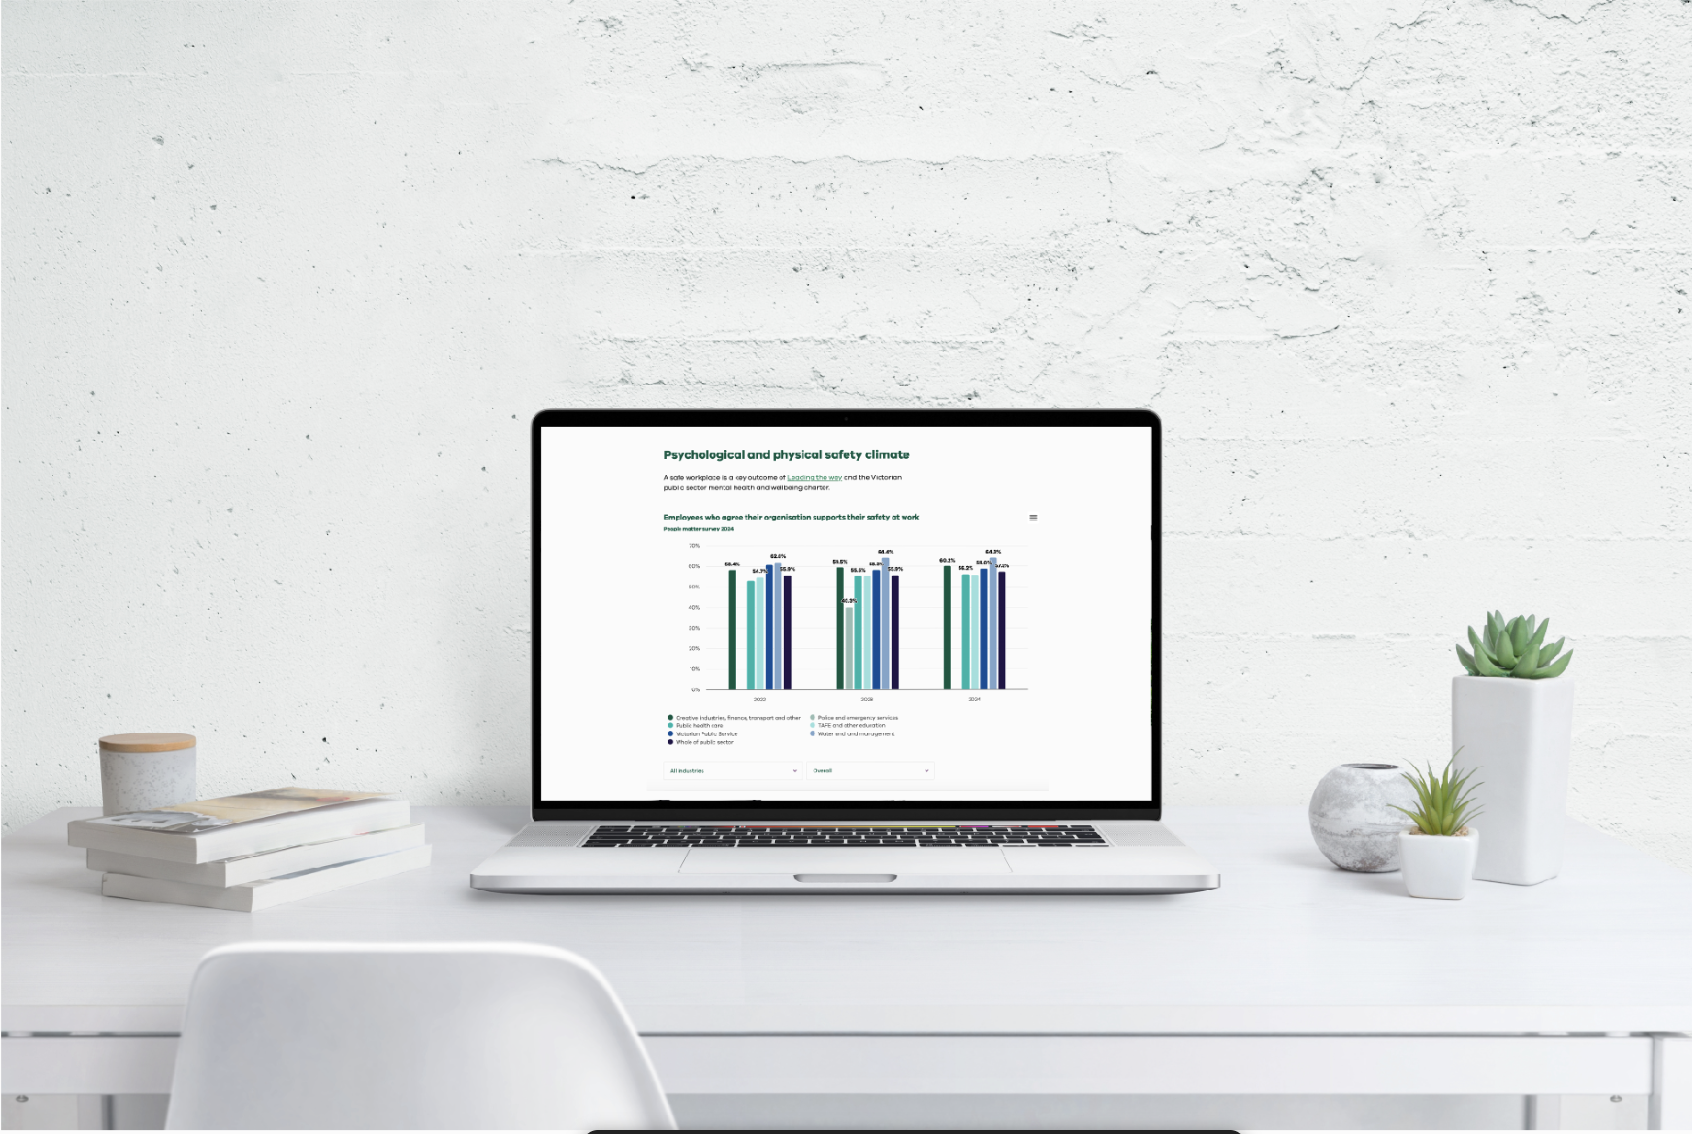
Each year, the Victorian Public Sector Commission publishes the State of the Public Sector — a detailed view of who works in the Victorian public sector and what their experience looks like.
More than 100,000 public sector employees participate in the People Matter Survey each year. The data covers things like workforce size and movement, pay and gender pay, diversity and representation and employee experiences.
The release helps government, researchers and the public understand what’s working and where change is needed.
-
The VPSC undertook a strategic program to shift the People Matter Survey and Workforce data reporting from a traditional print publication to a scalable, accessible digital platform.
The new digital experience needed to:
Remove printing and distribution costs.
Provide interactive dashboards with filters, comparisons and trend analysis.
Support a wide range of users — from Exectuvies, HR directors and data analysts to frontline staff.
Present complex survey data, insights and visuals in a clear plain language format.
Strengthen transparency by making the data easier for the public and agencies to access.
This transformation aligned with whole-of-government goals for better data, better digital services and a more capable public sector workforce.
-
My Role
As lead content designer, I was responsible for the content strategy, information architecture (IA), design patterns and user research. I also worked closely with designers, data analystis, marketing teams and executives to bring new digital concepts to life.
I designed, researched and delivered digital insight publications including:
Experience design and content leadership
Led discovery research and editing sessions with executives, HR practitioners, policy teams, organisational development leads and data analysts.
Translated dense, technical content into clear, intuitive data insights and stories.
Designed navigation models and content structures that supported both exploration and quick insights.
Delivery and governance
Established an agile delivery cadence and backlog governance structure.
Partnered with engineers and analysts to shape a sustainable data architecture and release model.
Managed risk, dependencies and data-quality considerations across multiple teams.
Change and adoption
Built onboarding, training and help-content systems to support the sector’s transition from print to digital.
Facilitated stakeholder workshops to build capability and embed continuous improvement.
-
1. Discovery and analysis:
Mapped the lifecycle and costs of the print-based report.
Identified key user frustrations: slow access, no filtering, difficulty locating relevant insights.
Documented essential data-use cases: culture improvement, workforce planning, integrity reporting, leadership decision making.
2. Co-design and prototyping
Ran co-design sessions to reimagine how information should be structured without the constraints of a printed book.
Developed prototypes for dashboards, filtering tools, and comparison views.
Validated designs with key users.
3. Iterative product development
Broke delivery into meaningful increments aligned with annual release cycles.
Introduced new workflows to prepare and visualise data, reducing manual processing.
Collaborated closely with data analyists, executives and communications team to ensure insights, data and information were accurate, transparent end ethical.
4. Accessibility and clarity
Ensured WCAG AA-compliant visualisations and interactions.
Added explanatory content so non-technical users could interpret metrics confidently.
5. Capability uplift
Provided training and documentation to help organisations adjust to the new digital reporting environment.
-
Financial and operational impact:
Reduced costs and environmental impact associated with annual print production.
Reduced delivery time by replacing one-off print cycles with flexible digital releases.
Impact on Victorian Government organisations and users:
Faster, self-service access to key workforce and culture metrics.
Dynamic filtering and comparable data sets
Better collaboration across organisations, integrity and leadership teams through shared, accessible data.
Impact on employees
Organisations could more easily turn insights into targeted wellbeing and culture initiatives.
Improved transparency strengthened trust and engagement.
Impact on the community
Public dashboards improved transparency and accountability, reinforcing trust in how the public sector manages and supports its workforce.
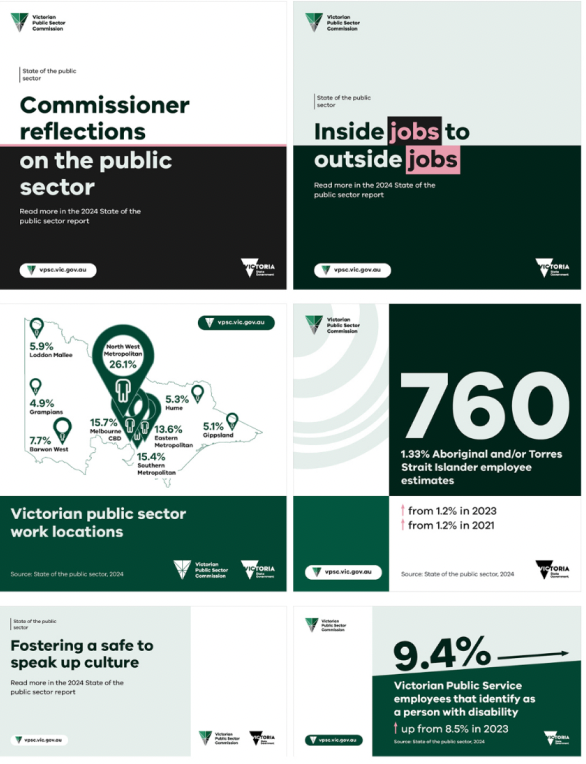
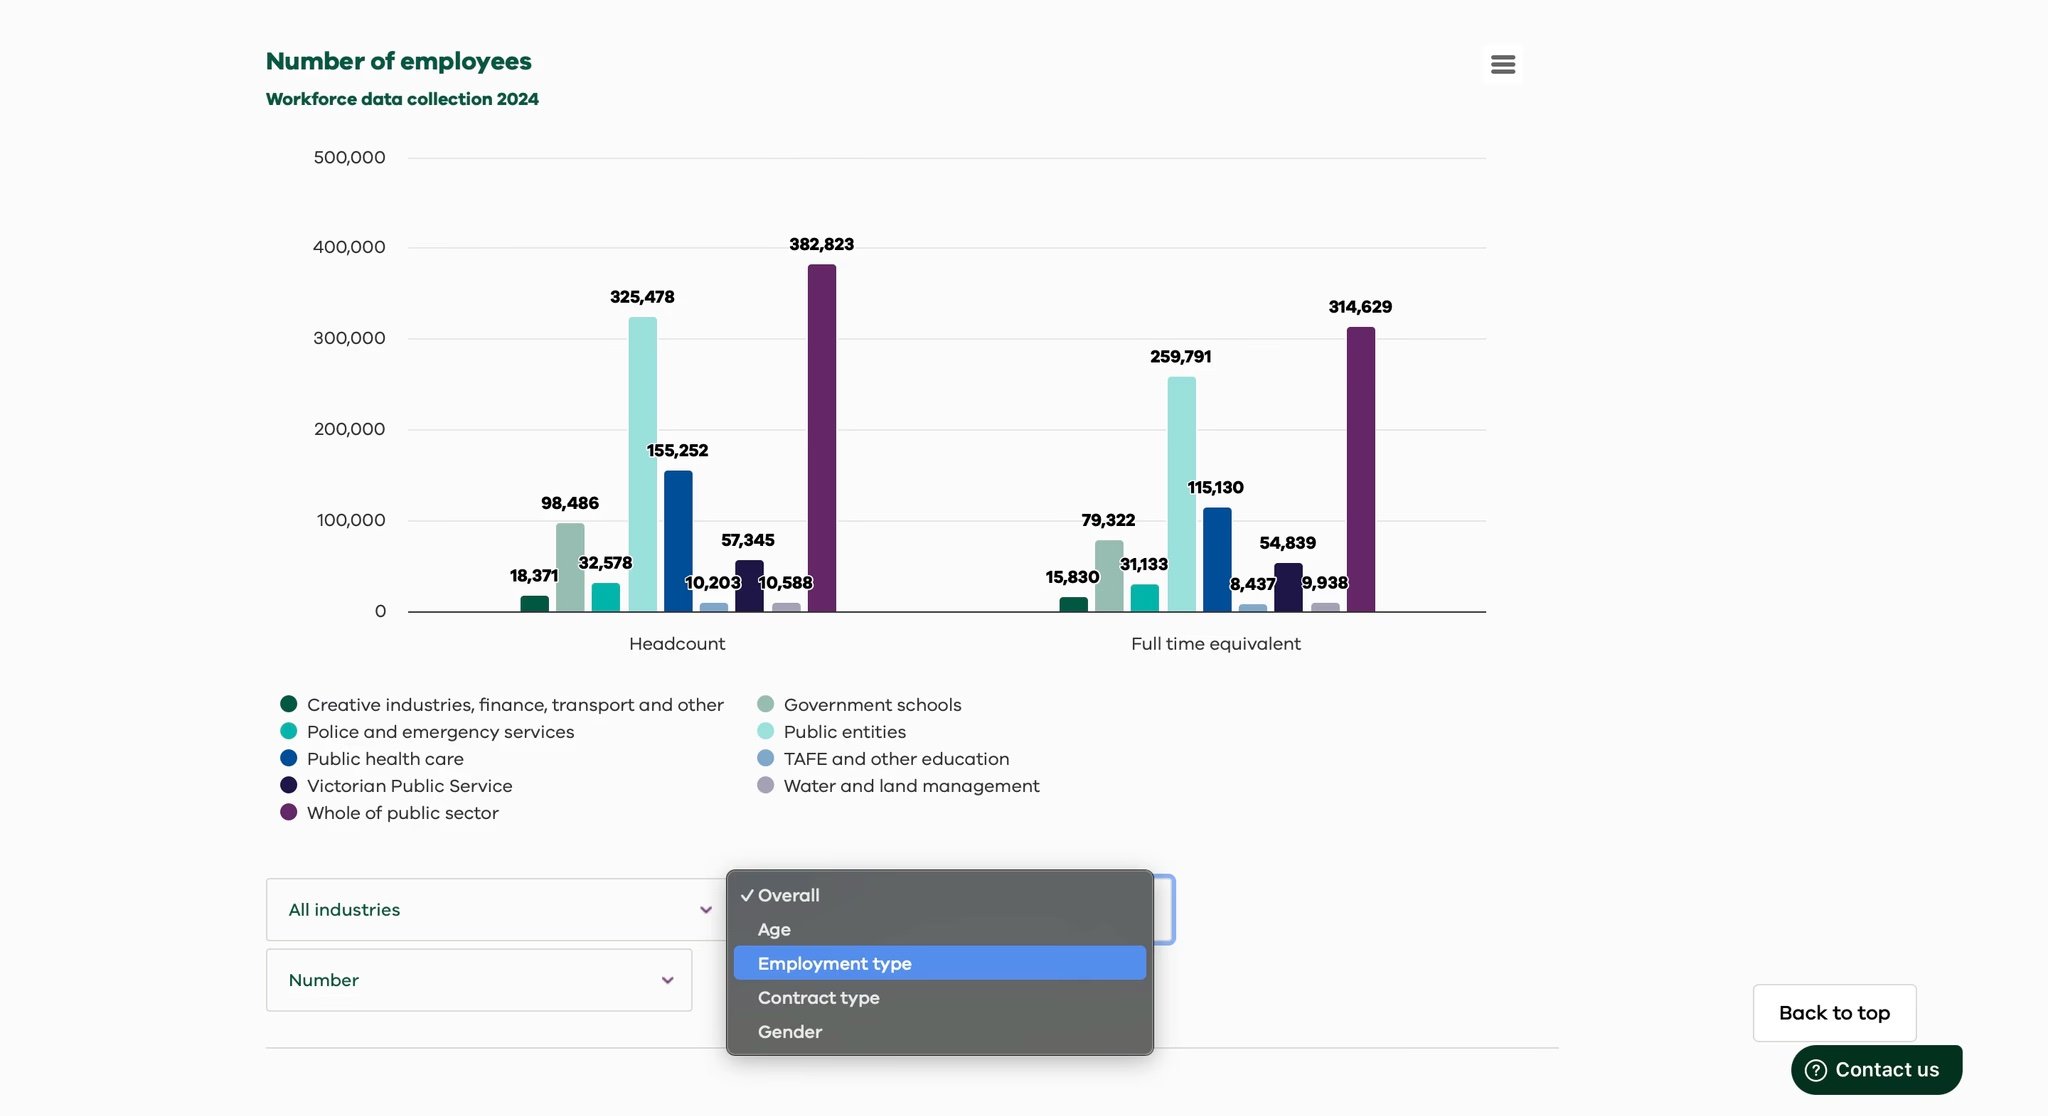
New interactive charts designed with Highcharts.
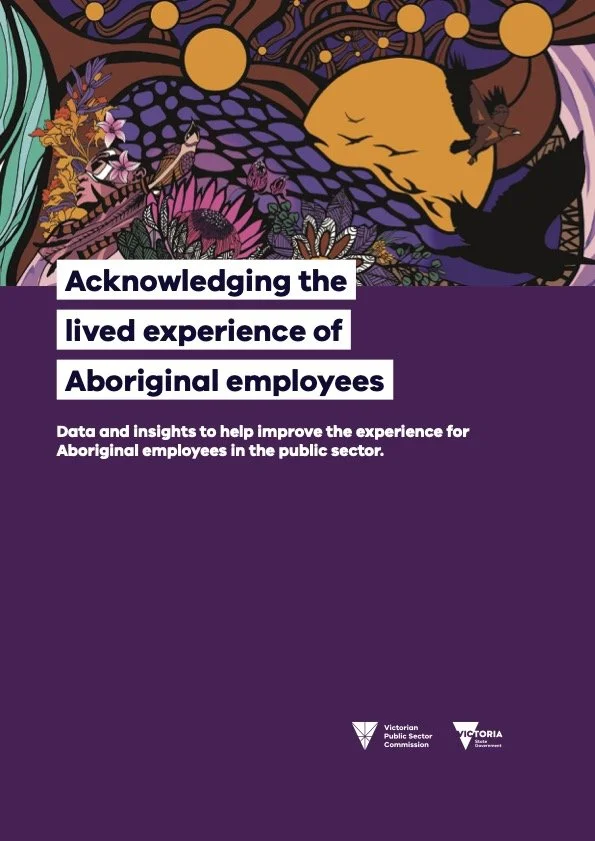
Data insights publication project managed, written and designed by myself in collaboration with Aboriginal employees and executives across the Victorian public sector.
Design of print publication and PDF before digial version.